Home / Case Studies / Churn Prediction
- NMachine Learning Tool
Churn Prediction Model
We have developed the churn prediction model for telecom operator Beeline.

What the client required
- Overall all accuracy is 75.5%
- The model catches 83% of the customers who will actually not churn
- The model catches 73% of the customers who will actually churn
A local Russian telecom operator wanted to improve their client satisfaction and prevent the clients to leave for competing companies.
They asked us to develop a churn prediction model with an automated gathering of the data from different database sources. The output of the model was the probability of leaving of the client’s churn.
Technology:
Python
Libraries:
- Pandas
- Numpy
- Sklearn
- Matplotlib
- Plotly
- Seaborn
- Xgboost
- Lightgbm
Solution:
We used machine learning models powered with the historical data, that client provided to predict future churn as accurately as possible. The deployment model is showing valuable figures daily.
The ML-powered model aims to tell you what is the probability of this or that client leaving your business within a specified period.
Algorithm development was divided into several parts:
- First-stage data preprocessing
- Data understanding
- Second-stage data preprocessing
- Feature engineering
- Models testing
Description of steps:
First-stage data preprocessing:
Data cleaning. I.e. to remove $ from monthlyBilling values.
Filling empty values, or removing rows, which include them.
Remove useless or almost empty columns.
Transform text values (for example, using regular expressions).
Remove columns with no sense.
Data understanding:
On this step we took a closer look at the data. Build plots and collect statistics.
Build theories about correlations between features and their distributions.
Identify outliers.
Trying to understand which model (or models) works best on such data.
Second-stage data preprocessing:
Removing of outliers. Fixing or/and removing rows with errors (i.e. typos in text values)
Feature engineering:
Creating new features or transforming existing ones (for example transforming categorical data to OneHotEncoded).
Also changing all non-number values in numbers (for example: male to 0, female to 1, LabelEncoding).
Some of the continues features we transform to a normal distribution using log1p operation.
Models testing:
In this part we develop different kinds of models. Often, they need differently transformed data.
So we prepare it for each algorithm.
And teach them on clean data. For identifying which model is better we used different metrics (F1 score, ROC AUC, etc).
And choose the most suitable model for our purposes.
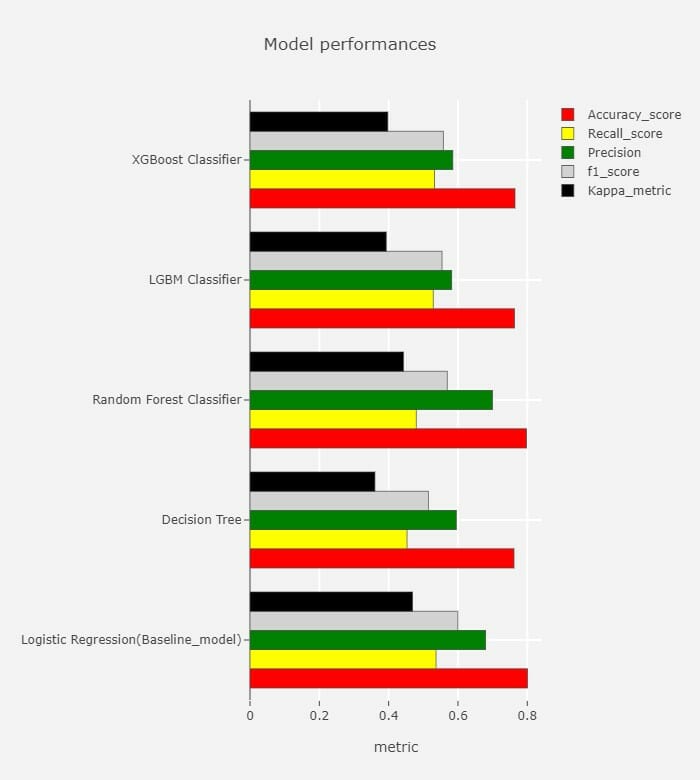
For our task the most suitable model is Logistic Regression.
It is simple yet powerful. And it is easy to interpret such a model.
Also, we tried XGBoost, LightGBM, Random Forest, Decision Tree.
Results:
Model performance

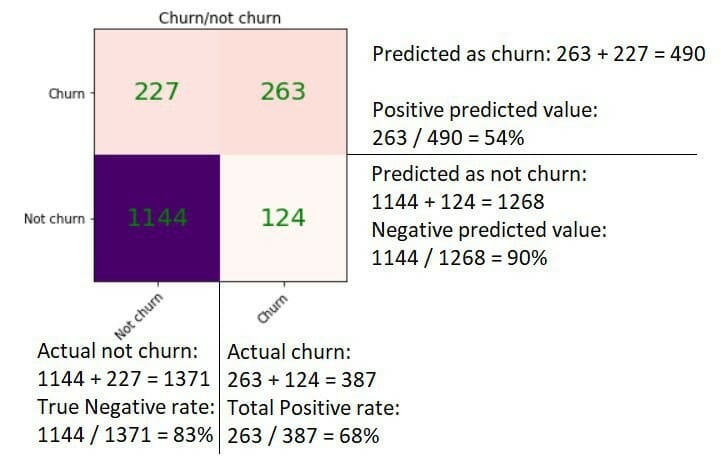
Calculation of results:

• This model catches 83% of the customers who will actually not churn
• The model catches 73% of the customers who will actually churn
• Overall all accuracy is 75.5%
• Out of the customers it predicted as will churn, 54% of them will actually churn
• Out of the customers it predicted as will Not churn, 90% of them will actually Not churn
Conclusion
The client was able to better manage churn risk with help of targeted marketing strategies while considering its client acquisition costs.
